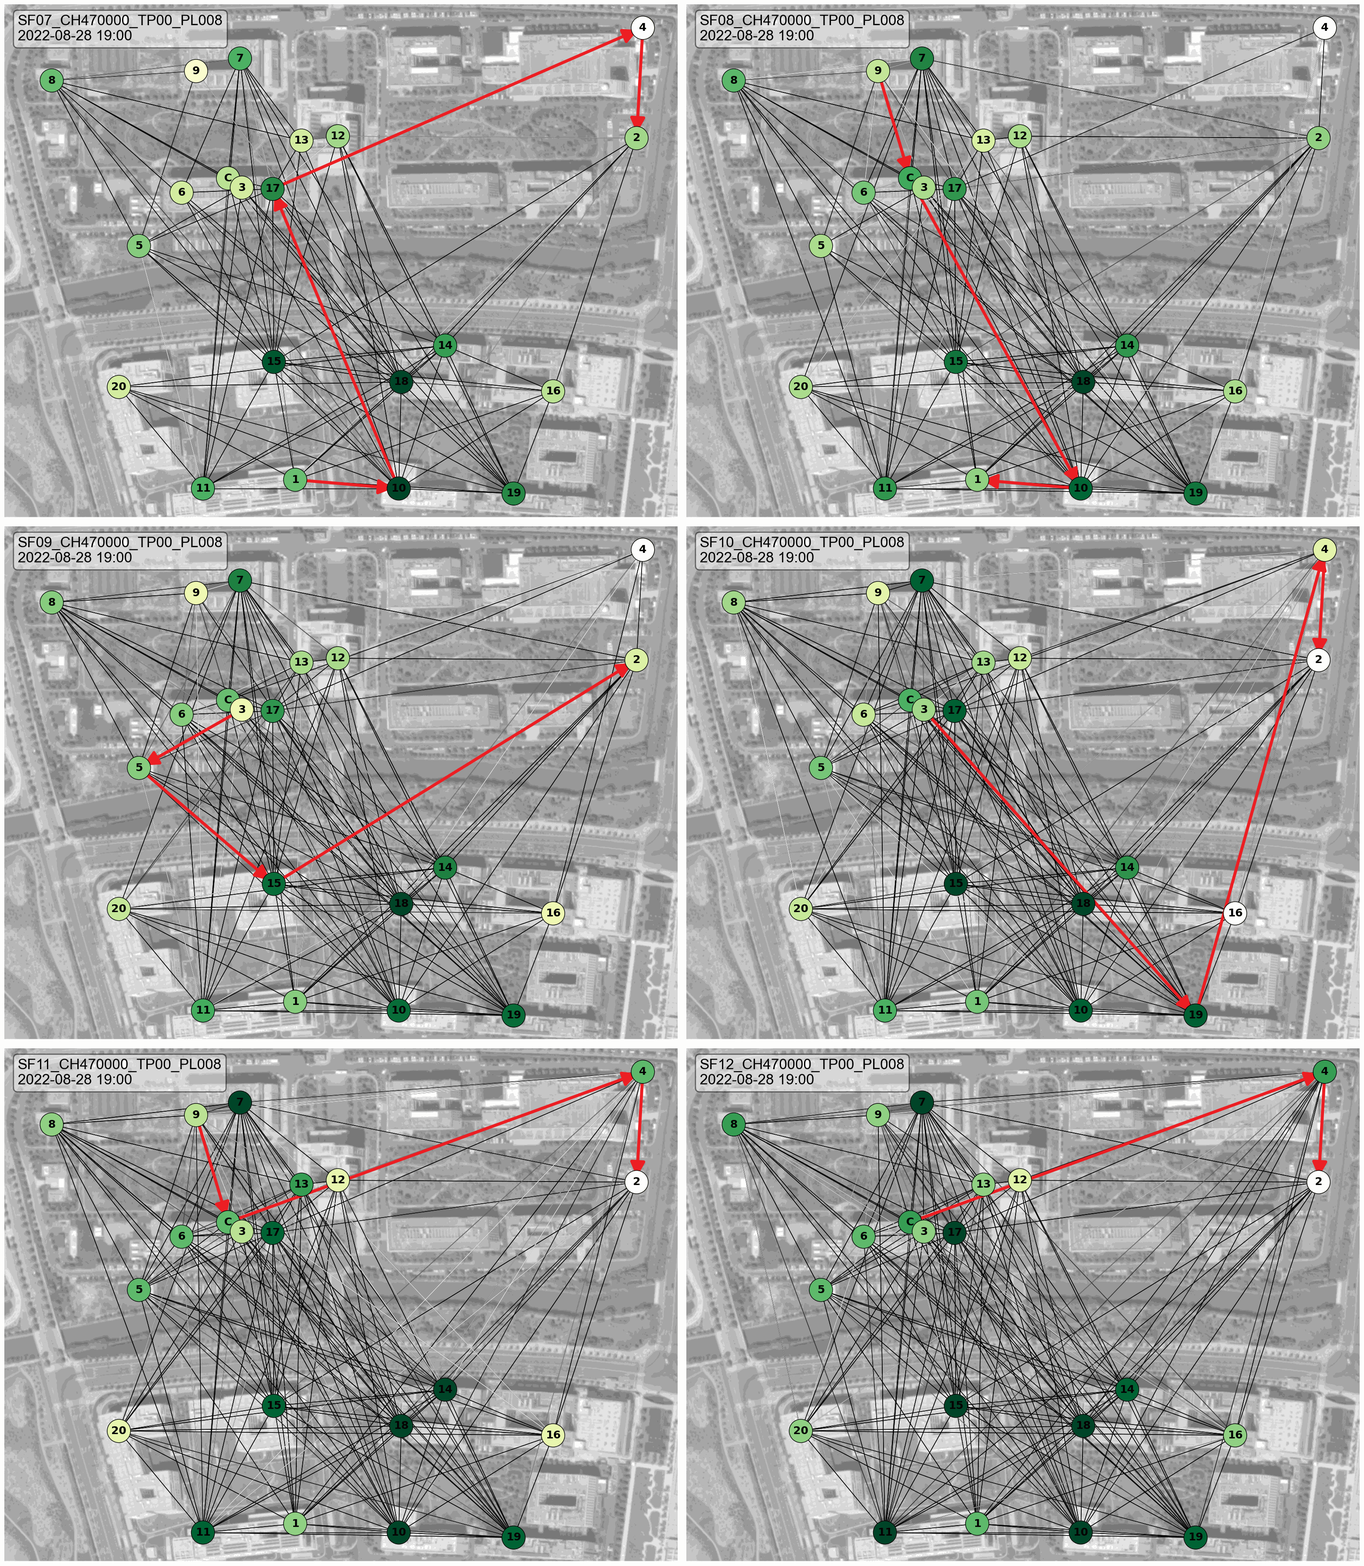
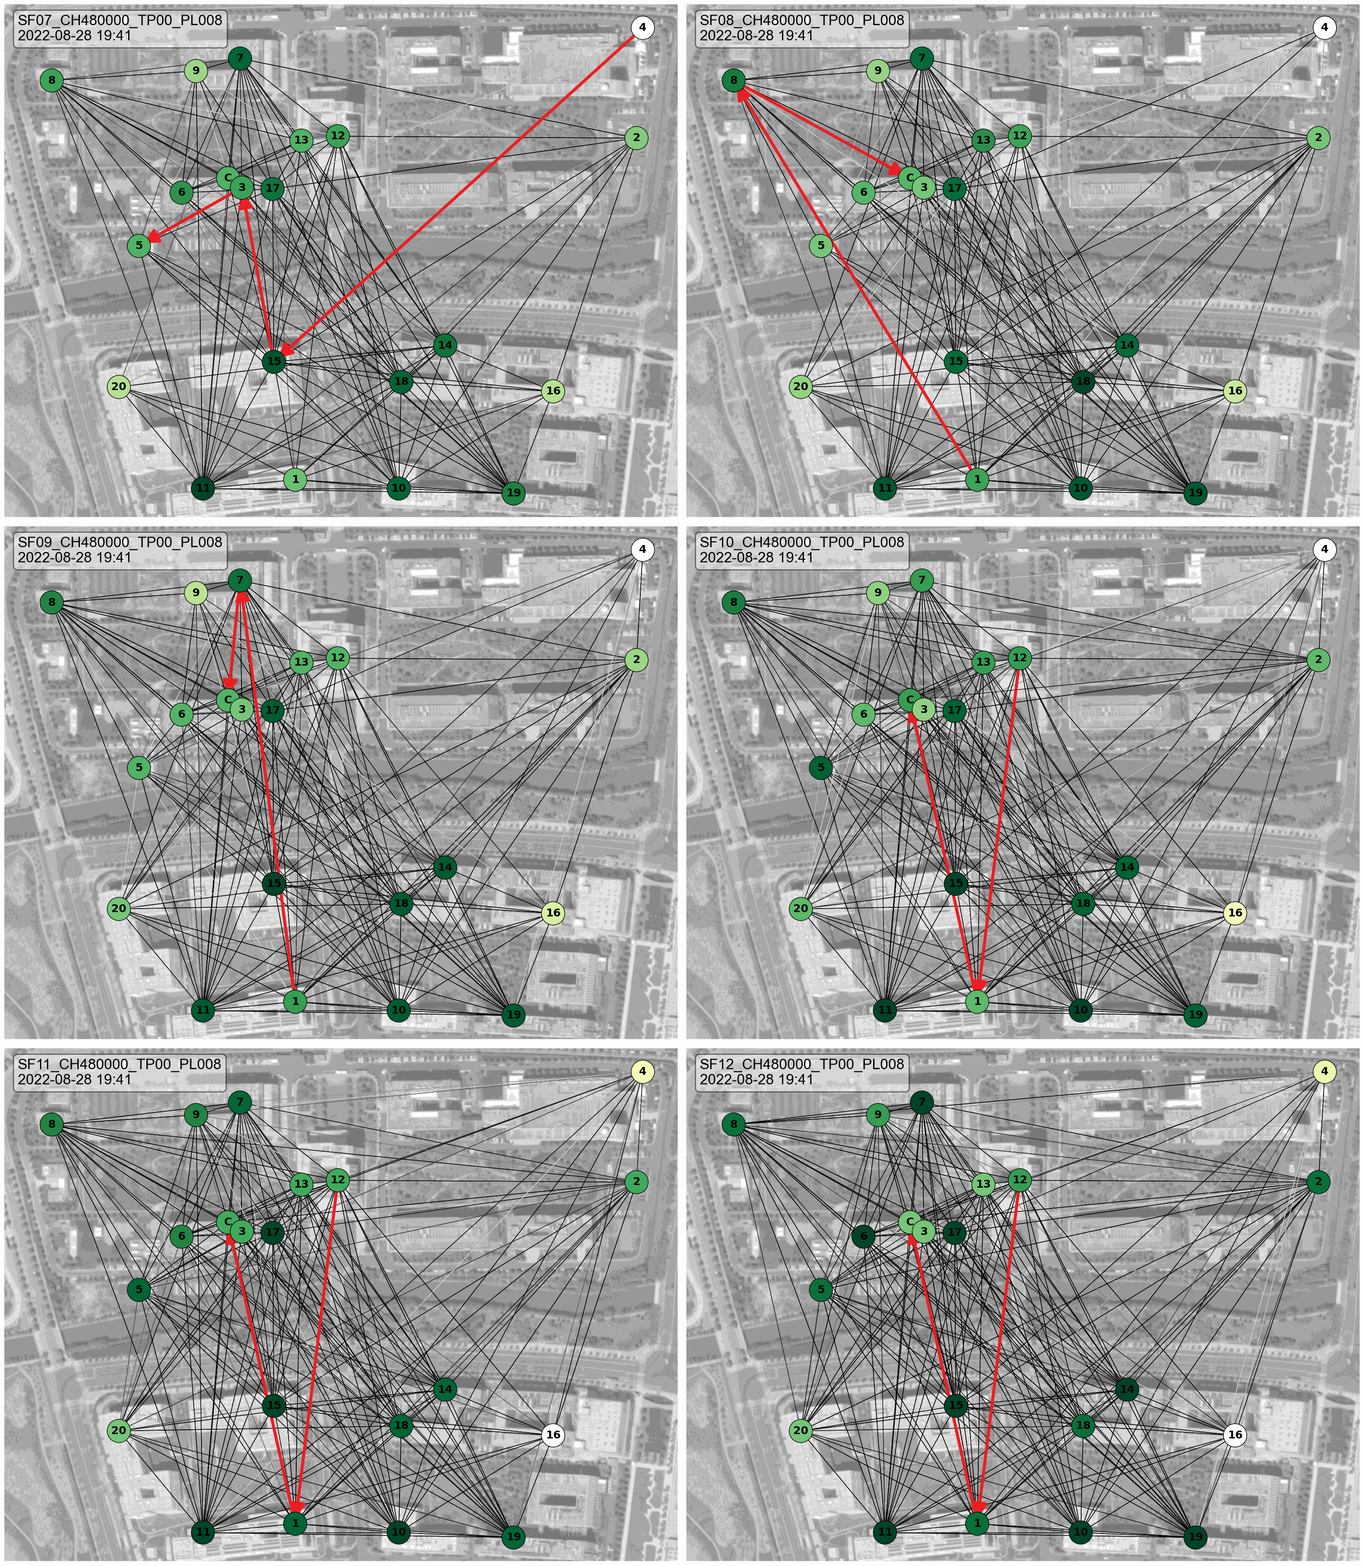
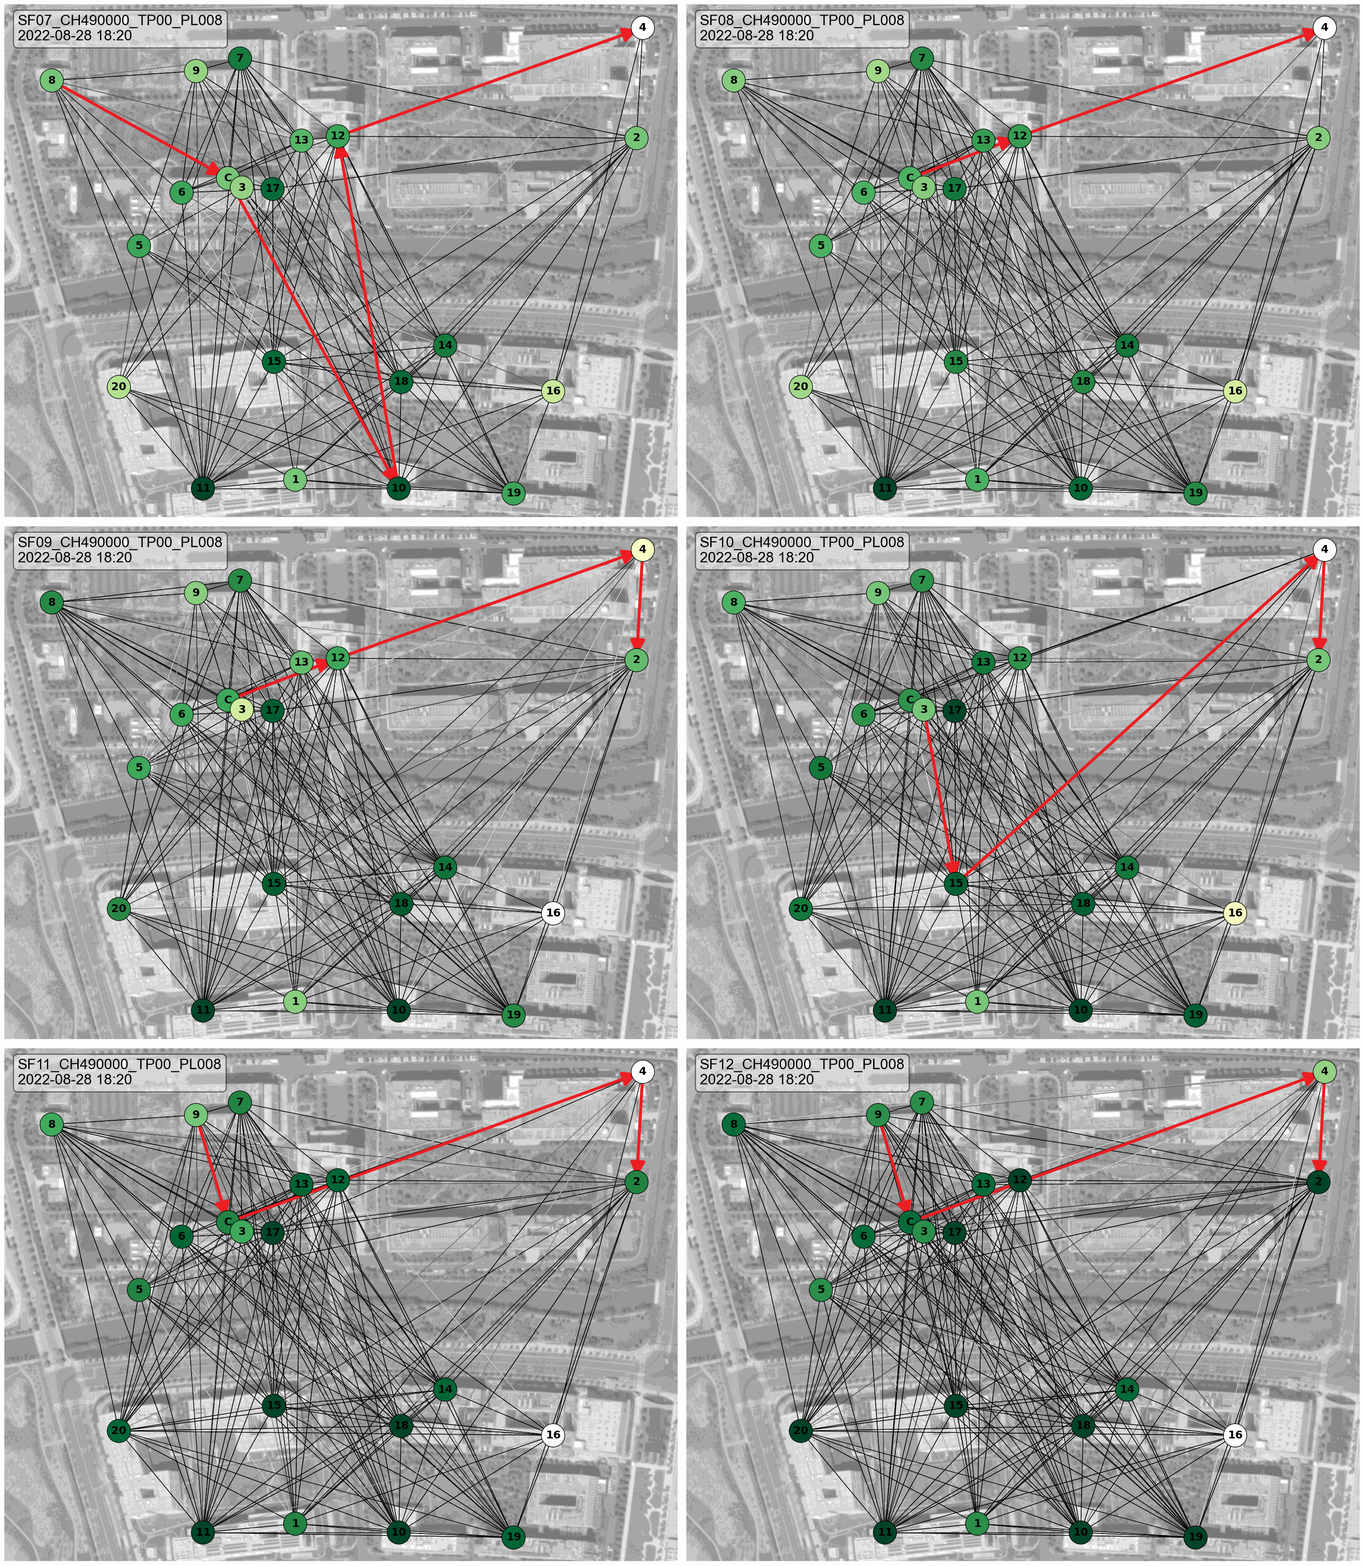
This page shows the current topology of ChirpBox nodes deployed in the SARI campus.
Monitoring setup:
Nodes on ChirpBox send same amount of packets in a round-robin manner on each spreading factor and channel. The packet delivery ratio (PDR) is then calculated as the ratio of received by other nodes and transmitted packets from the sender.
Note:
Node color: The depth representation of node color is based on the degree of the node. Higher the degree, darker the color.
Line color: The depth representation of line color is based on the PDR of the connection. Higher the PDR, darker the color.
Red line and arrow: The link with the max-hop from source node to target node.
Each channel shows topology on 6 SFs (SF 7 to SF 12).
The time shown in figures is the local monitor time (Shanghai time, UTC+08:00) of ChirpBox nodes.
Glossary:
SF: Spreading factor
CH: Channel (kHz)
TP: Tx power (dBm)
PL: Packet length (byte)
Topology:
Last update:
470 MHz

480 MHz

490 MHz

